


Market Balance
Brokers continue to see all 3 major commercial property buying/ selling markets as substantially oversupplied, by segment the Office Market being the most oversupplied, and by major metro Johannesburg being the most oversupplied.

We continue with the 4th quarter 2020 results of our FNB Commercial Property Broker Survey, which surveys a sample of commercial property brokers in and around the 6 major metros of South Africa, namely, City of Joburg and Ekurhuleni (Greater Johannesburg), Tshwane, EThekwini, City of Cape Town and Nelson Mandela Bay.
Given FNB Commercial Property Finance’s strong focus on the “Owner-Occupied” Property Segment, a pre-requisite in selecting broker respondents is that they deal in owner-serviced properties, but a portion will also have dealings in the developer or investor markets as well as in the listed sector.
In this report, we deal with questions relating to the perceived balance/imbalance between demand and supply of properties being transacted in main markets. Markets “strength” refers to a relatively strong demand level relative to supply, and vice versa for market “weakness”. These questions include estimates of average times of properties on the market prior to sale, as well as perceptions of whether demand exceeds supply or vice versa.
KEY THEMES THAT EMERGE FROM THE RESULTS ARE:
AVERAGE TIME ON THE MARKET STILL PERCEIVED AS INCREASING ACROSS ALL SEGMENTS, ALTHOUGH LESS SO.
From our residential market survey, we found the movement over time in the estimated average time of properties on the market prior to sale to be a useful indicator of changes in the balance between supply and demand, an increase in average time of properties on the market prior to sale signaling a deteriorating demand relative to supply and vice versa.
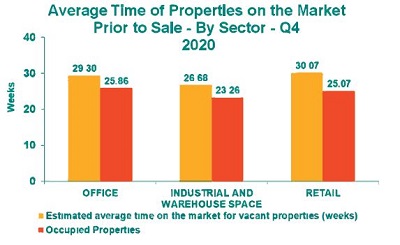
We have attempted to apply this same questioning our commercial property broker survey, splitting the survey by the 3 main property classes, namely Office, Industrial and Retail, and splitting it further by “Vacant Properties” vs “Occupied Properties”
In all 3 property classes, the occupied properties are reported to sell faster.
The relative picture between the 3 major property sectors is still one where brokers perceive the industrial Property Market to be the strongest of the 3classes, with an average time on the market for occupied industrial properties of 23.26 weeks being quicker than the 25.07 weeks in the case of retail and 25.86 weeks for office space.
Vacant industrial properties, too, averaged the shortest average time on the market of the 3 segments to the tune of 26.68 weeks, compared to 30.07 weeks in the case of retail space and 29.30weeksin the case of office properties, in the 4th quarter 2020 survey.
In the FNB Commercial Property Broker Survey, it is more difficult to estimate average time on the market than is the case in the FNB Residential Property Estate Agent Survey, given a far smaller sample size when it comes to a number of transactions, so from quarter to quarter the different groups of respondents do perceive average time quite differently, and the data moves can be more volatile.
However, in the easier-to-answer follow up question as to whether the past 6 months has seen the average time of properties on the market increase, decrease or remain unchanged, brokers appear better able to assess the direction in average time as opposed to the actual average time itself. And, on average, the respondents remain biased toward “lengthening average time on the market “although the bias becomes less pronounced in the 4th quarter compared the prior quarter.
And an increase in the average time on market over the past 6 months is the response that one would expect at a time of deep recession such as the one that has unfolded in South Africa, most notably from the 2nd quarter of 2020.
• Perceptions regarding the direction in “average time on market “over the past 6 months
The follow up question to the average time on the market estimate, is asking respondents whether they believe that the average time on the market has increased, decreased or stayed the same 6 months prior (i.e since the 2nd quarter of 2020).
Out of the responses we create an index by allocating a +1 score to an “increased” response a zero to an “unchanged” response and a negative -1 to a “declined” response.
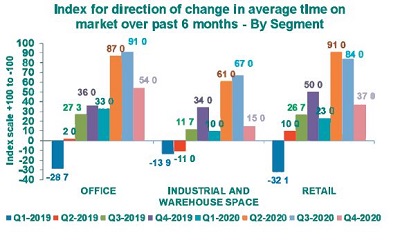
The scale of the “Index for direction of change in time on the market over the past 6months” is thus from +100 to -100. A score of +100 would imply that 100% of respondents perceived an increase in time on the market over the past 6 months (market weakening) and -100 would imply100% of respondents perceiving a decline, while a zero level would mean that those providing an “increased” response equals those responding with “decline”.
All 3 of the 3 property classes returned a positive number, implying that the aggregate of responses points towards an increase (market balance weakening) in average time of properties on the market compared to 6 months prior.
In addition, this “increased” bias in all 3 property classes was seen consistently in all 4 quarterly surveys of 2020.
However, the “increased” bias has become less pronounced in the 4th quarter compared to the prior quarter.
Industrial Property recorded +15 reading in the 4th quarter, down from +67 in the 3rd quarter. The Retail Index showed a more strongly positive reading of +37 in the 4th quarter, but this was also down from +84 in the previous quarter. The Office Index pointed towards the strongest broker bias in favour of lengthening time on the market, i.e. +54, but this too was down from its prior quarter’s +91 reading.
Therefore, while actual estimates of average time of properties on the market is difficult, and as such the trend in prior survey responses to this question aren’t always clear due to some volatility, the simpler follow-up question regarding direction in average time on market over the prior 6months has shown a less volatility and a clearer trend over most of the history of the survey towards an “increased time” bias.
That the “increasing time on market” bias became less pronounced in the 4th quarter survey, probably has much to do with the end of hard lockdown a few months earlier. 6 months prior to the 4th quarter survey, it was difficult to do property trades in the midst of hard lockdowns. So, rather than seeing any meaningful market strengthening, over the months to November 2020 we had merely seen a dramatic improvement in the ease of doing business since April/May.
But the fact that the brokers still have a bias towards lengthening average time on market continues to reflect the recessionary economic times in which South Africa finds itself.
The leaning by brokers towards average time on market having increased also appears to tie in with next question which asks them for their perceptions of property demand relative to supply in the market, where they lean towards an oversupplied market in all 3 propery sectors.
DEMAND VS SUPPLY STRENGTH PERCEPTIONS
An additional supply-vs-demand question is asked where the respondents are asked whether they perceive “demand far exceeds supply “(option 1), “demand exceeds supply somewhat” (option 2) the market is in balance” (option 3), “supply exceeds demand somewhat” (option 4) or “supply far exceeds demand” (Option 5).
All 3 property sectors have the majority of respondents pointing to “supply exceeding demand “, either “somewhat” or “far”. The Industrial Market possesses the lowest percentage of respondents, i.e. 74% perceiving supply to exceed demand, whereas 80% perceive supply to exceed demand in Retail Property and 95% in the case of the Office Property Market.
Once again we create an index from the responses, option 1 receiving a score of +2, option 2 a +1 score, option 3 a zero score, option 4 a 1-score and option 5 a -2score.
The index is thus on a scale of +200 to -200, where +200 would imply 100% of respondents choosing option 1, and -200 meaning a 100% OPTION 5 response.
All 3 sector indices were negative in the 4th quarter survey, with the Industrial Property Market least so on a -74 reading, followed by Retail at -106 and office recording the weakest -167.
In short, respondents strongly perceive all 3 markets to be significantly oversupplied, but with the Industrial Market believed to be the least oversupplied, followed by Retail and the Office.
PROVINCIAL COMPARISONS –DEMAND VS SUPPLY STRENGTH PERCEPTIONS
Due to smaller sample size at individual metro level, we are concerned with volatility in the surveys, and therefore opt to use a 2-quarter average of survey responses for the Demand-Supply Perceptions Indices for individual regions.
Examining the perceived market balance by major metro region, the Office Space survey points to Greater Johannesburg having the weakest demand vs supply balance, with its index being the most negative -180.5. This reading is noticeably weaker than the other 4 metro regions, which are all in a tight range between -142(Tshwane and Cape Town) and -150(Mandela Bay).
In the Industrial Property Market survey, the 3 coastal metros come out relatively stronger than the Gauteng Metros, with Nelson Mandela Bay having a positive reading of +49, followed by Cape Town with -5,and Ethekwini with with -14
At the weakest end of the Industrial Property Market is Greater Johannesburg, with a negative index reading of -137.5 followed by Tshwane with -87.
In the area of Retail Property, the survey points to significant oversupply across all 5 metro regions.
Joburg is the weakest market, with a negative reading of -170.5, followed by Cape Town with 100.5. The “least week” of the 5 was Ethekwini with a -38 reading, followed by Nelson Mandela Bay with -62.5.
CONCLUSION
Perceptions relating to demand relative to supply remain weak, regardless of whether one views the bias towards increasing time on the market, or the perceptions of demand vs supply.
In the follow up question as to perceptions of demand relative to supply, the broker group perception is tired strongly towards oversupply. This is most severely the case in the Office Property Market.
The 3rd and 4th quarter 2020 surveys, which were subsequent to the COVID-19 “hard lockdown” of the 2nd quarter, did show a mildly smaller bias by brokers towards “oversupply” in the buying-selling markets of the Industrial and Retail Property Markets. However, this was not the case in the Office Property Market, where the “oversupplied” bias continued to become stronger.
But all 3 markets have strong “oversupplied market: bias and this appears reflective of the deep economic recession in which South Africa’s economy has found itself in.
The oversupply comes as little surprise, given that the economy had been stagnating over many years prior to COVID-19, and then saw a massive -17.48% year- on year contraction in Real GDP (Gross Domestic Product) in the 2nd quarter, followed by a further year-on-year decline of -6.04% in the 3rd quarter. That is almost undoubtedly an economic environment driving weak demand and strong supply of property on the market, and the broker survey continues to reflect this.
The oversupplied market leads us to continue to expect decline in average property values to continue in 2021. After a predicted -7% decline in average capital value in 2020, our forecast for 2021 has been a further -9% decline. The ongoing oversupplied responses emanating from the FNB Property Broker Survey provides little reason as to why that expectation would change.
The first publicly available evidence of probable average value declines was the MSCI All Property capital growth rate, which showed negative growth to the tune of -5.2% half-on-half for the 1st half of 2020.
The sectoral picture that emerges from the survey component pertaining to market balance/strength is one of Industrial Property being the strongest market of the 3 major commercial property classes, i.e. Industrial, Office and Retail, but with all 3 markets showing significant oversupplies of the property relative to demand.
Within the Industrial Property Market, it would appear that the 3 coastal metros Industrial Property Market have been outperforming the 2 Gauteng Metros significantly. In the Retail Market, the 2 coastal metros of Ethekwini and Nelson Mandela Bay are perceived to be less oversupplied than the 2 Gauteng Metros and Cape Town, Joburg once again being the weakest market, And in the Office Market, it is Joburg that stands out as the weakest market, too, with the other 4 metros varying insignificantly from each other’s in perceived market balance.
Greater Johannesburg is thus perceived to be noticeably the weakest property market in all 3 property classes.
Finally, what has been noticeable in many of the survey question responses is that the Office Property Market appears to have surpassed the Retail Property Market in terms of being perceived by the brokers as the weakest of the 3 major markets.
This suggests that Office Property may be the weakest of the 3 major property classes in 2021, whereas in 2020 it was more the Retail Market that appeared to be the “weakest link”. Why the possible “switch”? Retail experienced the worst of the April/ May hard lockdowns and was the property class losing the most income in the 1st half of 2020 as a result. While office workers were largely sent to work at home during lockdown, many of the companies that they worked for were not locked down, so rent could still be paid to a far greater degree in the Office Market, and tenant income was far less negatively impacted.
But the Office Market had another looming problem. The forced remote working “experiment” was highly successful, and recent quarters broker surveys point to many companies re-assessing their office space needs, and many planning to lessen their amount of office space leased or owned. This process may well be gathering momentum in 2021. It is thus looking increasing likely that Office Property will be the underperformer of the 3 main commercial property classes in 2021.
Courtesy: The Agent - Estate Agency Affairs Board (EAAB)


© 2005 - 2026 | Portfolio Property Investments | Powered by the PPI Business Platform