SA Economy - The Most Recent Economic Stagnation, Starting around 2012
South African economy ‘running out of options’ for the poor, and this may be increasingly visible at the lower end of the residential rental market.

Around the time of the Global Financial Crisis (GFC) Recession of 2008/9, it wasn’t that clear that the ‘lower end’ of the residential rental market had the weakest tenants.
However, in more recent years, since around 2014, the tenant performance of the 2 lowest rental/month segments has weakened more noticeably than the higher 2 major segments, suggesting that the long period of broad economic stagnation since 2012 is taking a bigger toll on lower income households.
PRIOR TO 2014, THERE WAS NOT ALWAYS A CLEAR PERFORMANCE DIFFERENCE BETWEEN LOW END AND HIGHER END IN THE RENTAL MARKET.
During the tenant performance ‘dip’ of the 2008/9 Global Financial Crisis (GFC)-Related Recession, the differential in performance between the lower end of the Residential Rental Market and the higher segments was not that obvious.

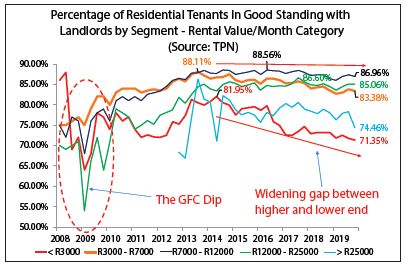
As a matter of fact, according to TPN tenant data, the worst drop in the percentage of tenants ‘in good standing’ with Landlords was not even in the lowest monthly rental category. It was higher up in the R12,000/month – R25,000/month market segment, which saw its tenants ‘in good standing’ percentage bottom at 54% in the 1st quarter of 2009.
The lowest rental category, i.e. less than R3,000/month category was 2nd-worst, bottoming at 64%, but the 2nd lowest rental segment i.e. the R3,000-R7,000/month segment actually outperformed the major 4 segments to record a more impressive 75% in the 1st quarter of 2009.
In other words, it wasn’t clear that the lower end of the rental market was a significantly higher risk segment than the higher end back in the GFC recession of over a decade ago.
That may well have been a reflection of a very strong economic period preceding that, GDP (Gross Domestic Product) growth having reached rates above 5% during some of the years leading up to the GFC.
Those years of strong economic growth, although driven by an unsustainable Household Sector spending spree, had done much to support job creation amongst lower income households and reduce inequality and poverty.
In addition, those earlier years were the years of a stronger Government Financial position and major expansion of the social grants system amongst the poor.
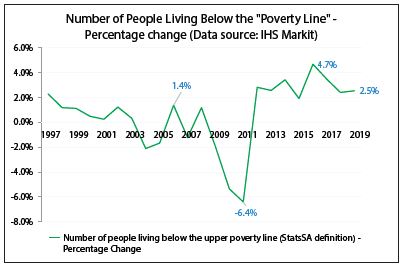
IHSMarkit data estimates show far lower growth in the number of people living in poverty prior to the GFC recession, and even a noticeable decline in this number from 2009-2011.
But in the past 5 years or so, economic stagnation appears to have been exacting a bigger toll on the poor….
However, thereafter, as economic growth never recovered to the rates prior to the GFC, and from 2012 started a long run stagnation, the impact of weak growth was seen in the more strongly rising poverty numbers, the estimated annual growth in the number of people living below the upper poverty line reaching 4.7% in 2016 (the highest growth in 2 decades worth of date – The ‘upper poverty line’ of StatsSA being R1,183/month as at 2018).
In addition, after some years of improvement (decline) in the Gini Coefficient for South Africa (a key measure of income inequality), showing a decline in the country’s income inequality from around 2001 to 2016, income inequality may have begun a gradual rising trend, this coefficient starting to rise gradually from a 2016 low point.
WHICH MAY BE SHOWING UP IN THE LOWER END OF THE RESIDENTIAL RENTAL MARKET
These slowly changing trends in poverty growth and income inequality, the likely consequence of some years of economic stagnation, appear to have become percentage of tenants in good standing almost consistently.
Focusing on the main 4 rental segment, as at the 2nd quarter of 2014, the ‘Less than R3,000/month rental segment reached its post-GFC high, in terms of the percentage of tenants ‘in good standing’ with landlords, to the tune of 81.95%. This was around 3 years after GDP growth hit its post-GFC peak in 2011, and the differential between this segment and the top performing R7,000-R12,000/month segment was less than 6 percentage points (the latter segment recording 87.62% of tenants in good standing).
From then on, however, as we progressed further into the longest business cycle downturn in post-World War 2 history, this high-low end gap became ever more pronounced, with the 2 lowest rents/month segments having deteriorated the most noticeably.
By the final quarter of 2019, the R3,000/month segment had fallen to 71.35% of tenants in good standing, over 15 percentage points below the 86.96% of the top performing ‘sweet spot’ R7,000-R12,000/month segment.
We must acknowledge that over the past 5 years there would have been some inflation-related ‘bracket creep’ by lower end tenants into higher segments, so the composition of the segments is changing gradually over time. But we nevertheless believe that the widening performance differential between low and high segments that is unfolding is more than just that.
Furthermore, we had seen some deterioration in the 2nd lowest rental/month segment too. From its post-GFC high of 88.11% tenants in good standing in the 3rd quarter of 2011, where the R3,000-R7,000/month rental segment was the top performing segment, we have seen this segment’s tenant performance decline to 83.38%. Although this is not a severe decline to date, this is a more significant decline than the upper 2 rental segments, and puts this segment below both of those in terms of tenant performance, 3.6 percentage points below the top performer.
Finally, what has also been noticed is a narrowing of the tenant performance gap between the highest of the 4 major rental segments, the R12,000-R25,000/month segment (currently in 2nd place) and the R7,000-R12,000/month segment. Whereas the former segment’s percentage of tenants in good standing was 3.3 percentage points late in 2013, it had narrowed to 1.9 percentage points by end-2019. It thus appears increasingly plausible that the R12,000-R25,000/month segment could become the outperformer at a stage, just going by the trends. Admittedly, this could be in part due to ‘sweet spot’ tenants from the R7,000-R12,000/month segment gradually inflating into the next segment up.
CONCLUSION
In earlier years of TPN tenant data, even in the GFC recession of 2008/9, there wasn’t a clear distinction between the tenant performance of the higher rental/month segments and the lower ones. We believe that this was due in part to some years of very strong economic growth prior to the GFC, which had boosted the incomes and financial strength of the lower income end of the country’s Household Sector. In the post-GFC years, however, we know that economic growth never recovered to those pre-2008 levels, and has broadly stagnated since 2012.
It is plausible that the less skilled/lower income part of the labour force sees its employment and income opportunities recede to a greater degree than the highly skilled/higher income segment, during times of economic stagnation.
And indeed, IHSMarkit data shows more rapid poverty growth in recent years than prior, as well as early signs of rising income inequality, following prior improvement in this regard.
All this, in turn, may be increasing the residential rental market’s tenant performance differential by rental /month segment, the lower 2 major segments underperforming the higher 2 major rental segments by a widening margin.
This widening in the performance gap was the multi-year trend prior to COVID-19, and it is likely that the relative pressure of the deepening COVID-19 will be greater at the lower end of the rental market where financial situations are already significantly more fragile than ‘higher up’.
Courtesy: Estate Agency Affairs Board


