


HEADLINES
The data in this report is backwardlooking and covers the period up to 31 March when Covid-19 was at its peak in parts of Asia but had yet to take its toll on large parts of Europe, North or South America.
As we’ve outlined in our regular Covid-19 daily updates since the start of the pandemic, we expect sales volumes to feel the impact of Covid-19 more than prices with employment protection schemes and mortgage holidays in many advanced economies likely to reduce the number of distressed sales and hence the likelihood of price falls.
Whilst the index’s overall performance may not drop significantly, we do expect the city rankings to look very different in six to 12 months’ time with those markets that have been effective in containing the pandemic, and where lockdowns were short-lived, most likely to show more resilience.
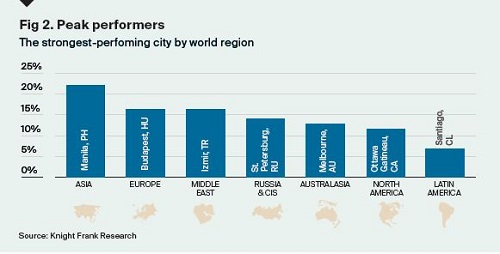
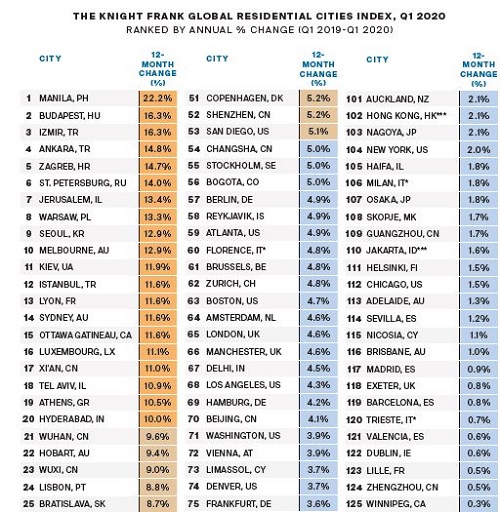
Manila leads the annual rankings for the second consecutive quarter with price growth of 22% in the year to March 2020.
Budapest continues to lead European cities with growth of 16%. Zagreb and Warsaw make up the trio of Central and Eastern European cities in the top ten.
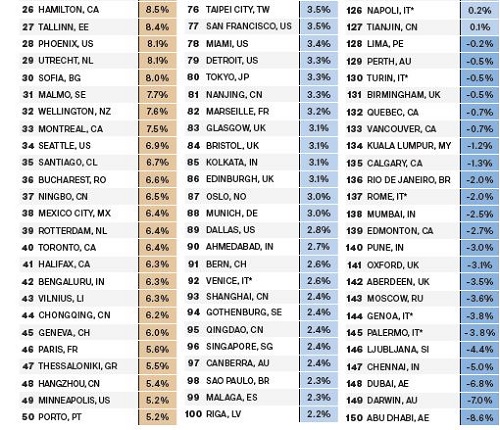
Aside from Manila, Seoul and Melbourne are Asia Pacific’s top performers, both with annual growth of 13%. Overall, the index increased by 4.3% in the 12 months to March, its highest annual rate of growth since Q3 2017. Of the 150 cities tracked, 85% saw prices increase over the year to March.
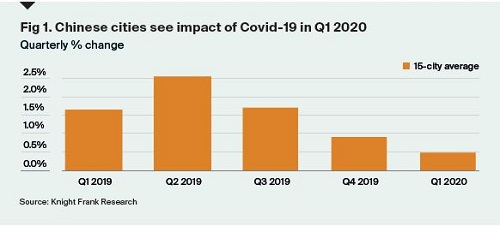
A look at the 15 cities with largest GDP across China and the US, underlines the extent of the slowdown in China in the first quarter of 2020 with average price growth reaching just 0.4% (figure 1), the lowest average quarterly rate of growth for the 15 cities since Q1 2008.
Courtesy: Knight Frank

CONTACT DETAILS, FOR FURTHER INFORMATION:
Mark Harvey - Sales Enquiries
+44 20 7861 5034
Kate Everett-Allen - Research Enquiries
+44 20 7167 2497
DISCLAIMER
Knight Frank Research provides strategic advice, consultancy services and forecasting to a wide range of clients worldwide including developers, investors, funding organisations, corporate institutions and the public sector. All our clients recognise the need for expert independent advice customised to their specific needs. © Knight Frank LLP 2020. Terms of use: This report is published for general information only and not to be relied upon in any way. All information is for personal use only and should not be used in any part for commercial third party use. By continuing to access the report, it is recognised that a licence is granted only to use the reports and all content therein in this way. Although high standards have been used in the preparation of the information, analysis, views and projections presented in this report, no responsibility or liability whatsoever can be accepted by Knight Frank LLP for any loss or damage resultant from any use of, reliance on or reference to the contents of this document. As a general report, this material does not necessarily represent the view of Knight Frank LLP in relation to particular properties or projects. The content is strictly copyright and reproduction of the whole or part of it in any form is prohibited without prior written approval from Knight Frank LLP. Knight Frank LLP is a limited liability partnership registered in England with registered number OC305934. Our registered office is 55 Baker Street, London, W1U 8AN, where you may look at a list of members’ names.

© 2005 - 2026 | Portfolio Property Investments | Powered by the PPI Business Platform