


Residential Sector Q1 | 2017
Special Issue by Guest Writer John Loos, FNB Property Strategist
Could Tenant Payment Performance be Nearing an Improvement?
What is the payment performance situation?
Since around 2014 we have witnessed a gradual deterioration in tenant payment performance nationally. The percentage of tenants “in good standing” with their landlords reached a multi-year peak of 85.95% in the 3rd quarter of 2014. Since then, this percentage has declined by just over 3 percentage points to 82.77% by the 1st quarter of 2017.
How bad is this deterioration in tenant performance of recent years?
By historic standards, the most recent level of the percentage of tenants in good standing is not too bad at 82.77%, given that during the recessionary period of 2008, which included interest rates peaking at a Prime Rate of 15.5% (after 5 percentage points’ worth of rate hiking from mid-2006 to mid-2008), this percentage dipped to as low as 71%.
However, the situation is perhaps a little worse than the most recent percentage of tenants in good standing indicates. We say this because the percentage of tenants in good standing is made up of all tenants who have paid on time, those who paid late, and those who received a grace period in which to pay.
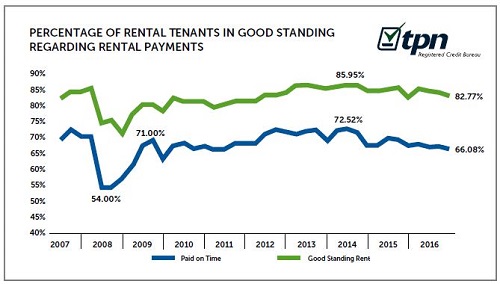
If we only take those who paid in full and on time, this percentage has declined more substantially, by over 6 percentage points, from a 72.52% high in the 3rd quarter of 2015 to 66.08% in the 1st quarter of 2017. Mounting financial pressure is often a gradual process. Certain tenants will initially go from paying on time to paying late, or obtaining a grace period from the landlord. This is the first sign of financial pressure building, even though they would still be in good standing with the landlord, and only later in many instances will some stop paying altogether or only pay partial payments.
Therefore, in order to obtain “early warning” signs, the trick is to break down the categories of payment performance, and look at the percentage “paying late or grace period”, those making partial payments, and those who did not pay”.
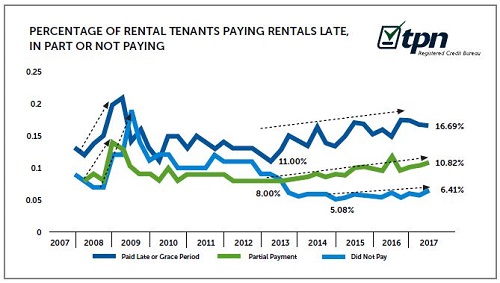
Then we see a slightly different picture. We see that the percentage who “paid late or had a grace period” began to rise broadly from an earlier stage in late-2012. In early-2013, we began to see a gradual rise in the percentage of partial payments. Then, only significantly later in late-2014 did the percentage who “did not pay” begin to rise gradually.
Therefore, the financial pressure in the rental market actually started to increase gradually from around late- 2012, although the noticeable impact on the percentage of tenants in good standing was only witnessed later from 2014 onward.
It’s the economy...
What happened in 2012 to “start the ball rolling”? Interest rate hiking only started early in 2014. 2012 was the year in which economic growth started to gradually stagnate, following the post-2008/9 recession recovery which peaked in 2011.
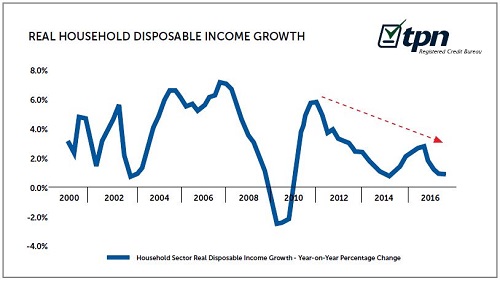
This began to broadly slow the pace of Household Sector Disposable Income Growth.
From a high of 5.9% year-on-year growth in Real Household Disposable Income in the 1st quarter of 2011, the rate has dwindled all the way to 0.9% by the 4th quarter of 2016, on the back of economic growth weakness and a rising personal tax burden.
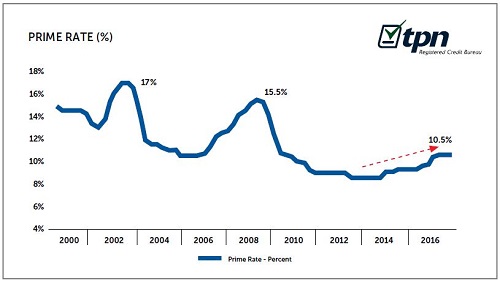
Then, after an initial squeeze from a slowdown in the economy and Household Disposable Income growth, we saw the start of very mild interest rate hiking, to the tune of 2 percentage points in total, from early-2014 to early-2016. From 8.5% at the start of 2014, Prime Rate rose to its current level of 10.5% by March 2016.
A further source of mild financial pressure was added to the part of the tenant population that was indebted.
But why has the deterioration in tenant payment performance not been as bad as in 2008?
A key reason why the tenants “in good standing” as well as the “paid on time” percentages remain at far better levels than the dip of 2008 is, firstly, due to the most recent interest rate hiking cycle (to date) having been far more moderate than the previous hiking cycle from 2006 to 2008. Whereas Prime Rate peaked at 15.5% in 2008, it currently sits at a far lower 10.5% despite the rate hiking so far.
While rental costs are not directly linked to interest rates, rental payments do compete with debt obligations of tenants for that limited disposable income “pie”, and increases in the cost of repaying debt can thus make it more difficult for certain indebted tenants to pay their rentals. The level of interest rates as well as the level of indebtedness is thus a key influence on tenants ability to pay their monthly rentals.
Secondly, although the economic growth and Household Disposable Income growth rates have slowed in recent years, they have not contracted very sharply as was the case in 2008/9
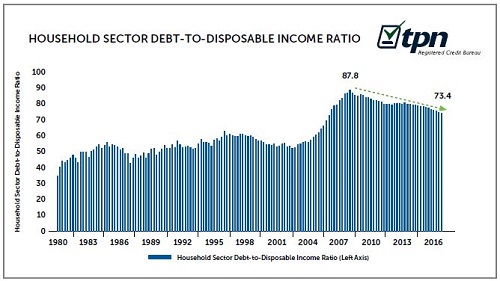
But a further key reason that must be acknowledged is the decline in the level of Household Sector Indebtedness since 2008. Since the all-time high of 87.8 as at the 1st quarter of 2008 (a contributing factor to the immense financial stress in 2008 when interest rates previously peaked), the Household Sector Debt-to-Disposable Income Ratio has fallen significantly to 73.4 by the end of 2016. This is the result of very slow Household Credit growth, which has for long periods underperformed even the mediocre nominal disposable income growth rate.
A lower debt ratio reduces the Household Sector’s vulnerability to interest rate hiking, and this would have partially protected SA’s tenant population.
So what’s the ultimate economic indicator of tenant payment performance?
Looking for the best single economic indicator with which to explain or perhaps predict tenant payment performance, we believe that we find it in the so-called Household Sector Debt-Service Ratio.
This ratio represents the total interest payment cost on the total Household Sector Debt Burden, expressed as a ratio or percentage of Household Sector Disposable Income.
The factors that move it are changes in the Household Debt-to-Disposable Income Ratio, i.e. the level of indebtedness relative to disposable income, and changes in interest rate levels. Therefore, much is reflected in this ratio, including the economy’s impact via its impact on Disposable Income growth, growth rates in Household Credit, and interest rate moves.
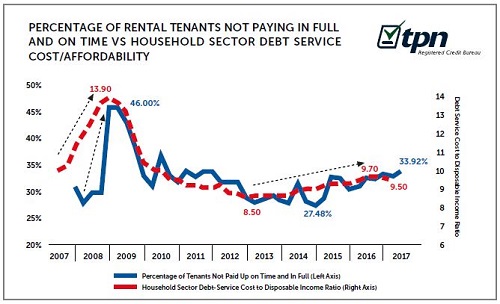
In 2007, we saw a sharp rise in the Household Debt-Service Ratio, driven higher by rising indebtedness at the time along with rising interest rates, leading a sharp rise in the percentage of tenants not paid up on time and in full.
Once again, in 2013, the Debt-Service Ratio started to rise mildly, initially due to a temporary small rise in the Debt-to-Disposable Income Ratio (before it resumed its decline again thereafter), and then from early-2014 due to rising interest rates.
However, unlike 2008 where the Debt Service Ratio peaked at 13.9, in the 2nd quarter of 2016 it peaked at a far lesser 9.7. Lower Debt-Service Ratio (compared to 2008’s high) should equal a lower level of tenants in arrears this time around and indeed this has been the case.
So where too from here for tenant performance?
There exists the possibility that tenant payment performance could improve mildly in the near term. The alleviation of domestic drought conditions in SA could see food price inflation decline quite nicely, to take overall CPI (Consumer Price Index) inflation back into the SARB’s (South African Reserve Bank) 3-6% target range. This could see the SARB holding interest rates at current levels throughout 2017, while some even speculate on interest rate cuts.
Interest rates have been on hold since March 2016, and already we have seen the Debt Service Ratio declining in the final 2 quarters of 2016 (from 9.7 in the 2nd quarter of 2016 to 9.5 in the final quarter) due to ongoing decline in the level of Household Sector Indebtedness.
Given very slow Household Credit growth rates, caused in part by very weak levels of consumer confidence, it looks very likely that the Debt-to-Disposable Income Ratio and the Debt-Service Ratio could continue to decline in 2017. That would appear to point towards a less financially pressured tenant population on average.
But beware the risks...
Of course such expectations of tenant payment performance improvement can be blown out of the water should the current climate of social tensions and political uncertainty translate into any major deterioration in investor sentiment, capital outflows, and a sharp Rand depreciation. The SARB does not target Rand depreciations directly, but should a sharply weaker Rand translate into sharply higher imported product prices, and higher local CPI inflation as a result, at some point renewed interest rate hiking in response to an inflation surge could take place. This is an ongoing risk to the SA tenant population’s payment performance, either directly via an impact on the cost of any of their debt, or indirectly via a negative economic impact that could suppress job creation and income growth.
Which monthly rental payment value category is most sensitive to economic and interest rate changes?
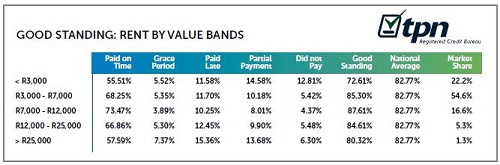
The low end leads the deterioration, becoming the group with the weakest payment performance in the 1st quarter of 2017.
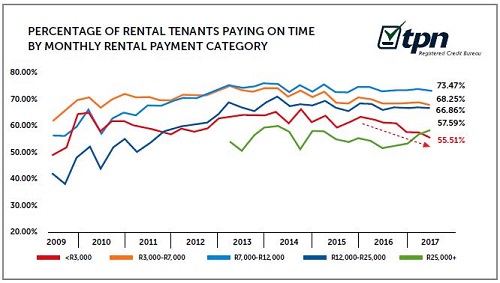
The lowest monthly rental value category, namely those tenants who pay less than R3,000 per month, are seemingly the most sensitive to economic and interest rate changes. During the recent years of deterioration in the percentage of tenants paid up on time, the Less than R3,000/month rental category has weakened the most noticeably to date, and in the 1st quarter of 2017 moved to a level lower than that of the permanently low R25,000+/month rental value, to register 55.51% of tenants being paid up on time.
This percentage represents a 10.5 percentage point drop from a 66% multi-year high recorded in the 2nd quarter of 2014, and is the most significant decline of any tenant payment value group in recent years.
The R7,000-R12,000/month rental payment value group continues to have the best paid on time performance to the tune of 73.47%, its best performing position having prevailed continuously since the 2nd quarter of 2012.
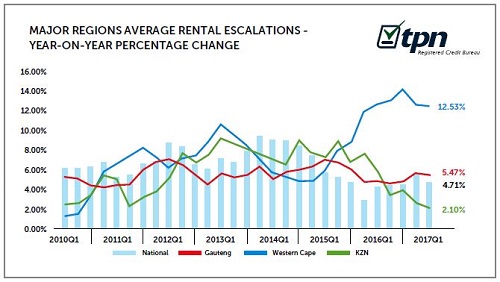
Like everything in property these days, it seems the rental market is also a Western Cape story
Western Cape rental escalations were in double-digits, its rental market probably being boosted by deteriorating home price affordability making it more difficult for many aspirant home buyers to buy.
Most things in residential property these days seem to be about the Western Cape. That province’s home buying market has boomed, while the rest of the country has been mired in mediocrity. Much of this strength, we believe, has to do with the Western Cape having marketed itself very successfully as both a lifestyle province as well as being one which is well managed and run.
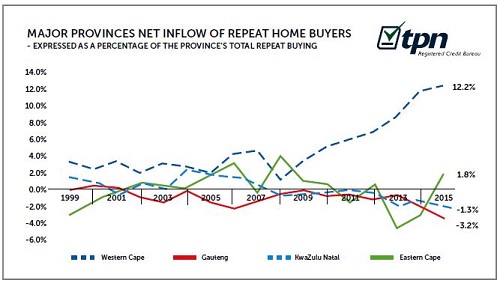
The result has been a strong migration of middle to higher income households to the province, which has exerted upward pressure on its house prices in recent years. This migration to the Western Cape of a combination of working and business people, as well as retirees, is visible in FNB’s studies of repeat home buyer migration between provinces.
In 2015, FNB’s most recent annual repeat buyer migration estimate, the Western Cape Province experienced an estimated net inflow of repeat home buyers ( net = those arriving minus those leaving the province) to the tune of +12.2% of that province’s total repeat home buying.
By comparison, Gauteng had a net outflow of repeat home buyers to the tune of -3.2% of its own repeat home buying levels, and the other major provinces didn’t fare much better.
The upward pressure on house prices that this repeat home buyer migration has caused, we believe, has contributed to a major affordability challenge for many in this relatively land scarce province, especially (but not only) amongst younger aspirant 1st time buyers, and has for many made the rental option relatively more attractive in the Western Cape.
Possible evidence of Cape Town affordability challenges which may have boosted rental demand come from FNB’s Estate Agent Survey which, for the 2 summer 2016/17 quarters showed a very low estimate of 1st time buyer levels in the City of Cape Town.
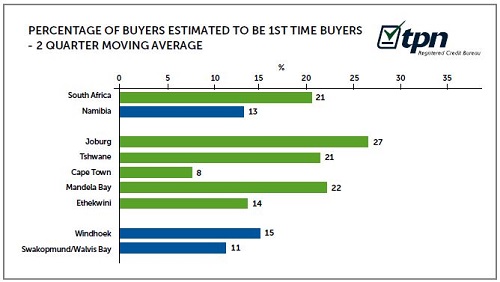
Whereas Joburg and Tshwane’s sample of agents surveyed estimated that 1st time home buyers amounted to 27% and 21% of total home buyers respectively, Cape Town’s estimate was a lowly 8%.
We suspect that this low estimate may well be reflective of a significant home buying affordability deterioration in recent years, as the already-expensive Cape Town market got significantly more expensive.
Where would many of these aspirant young home buyers go? Probably in many cases into the rental market for the time being, saving up to be able to purchase a home at an older age.
If one looks at the recent strength of the Western Cape’s home buying market, therefore, it comes as no surprise that the province’s rental market is also not .
But it is more than just about home in-affordability. Rental market health is probably also driven by a superior Western Cape economy.
It would be easy to suggest that it is only the relative in-affordability of home buying in the Western Cape which is driving its rental market, but that is not the whole truth.
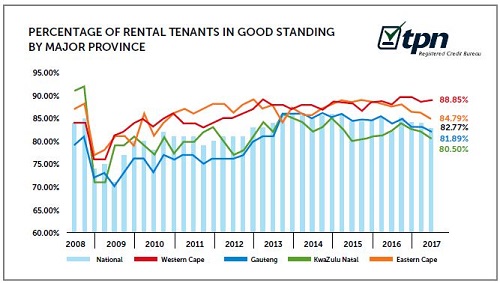
If we examine the percentage of tenants in good standing with their landlords, the Western Cape once again comes out tops of all 9 provinces. In addition, to date we have not yet seen a noteworthy decline in this percentage in the Western Cape, whereas the other 3 major provinces as well as the National Average percentage of tenants in good standing have all slipped more noticeably.
This suggests that strong rental escalations have yet to exert noticeable pressure on the tenant population due to possible deteriorating rental affordability.
This, along with the province’s superior performance in the home buying market, seems to suggest that its economic growth and Household Disposable Income growth performance is outstripping the other regions of late.
The National Rental Market by Numbers: By value and by region.
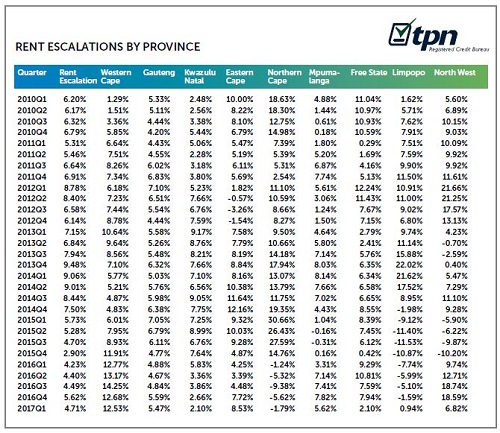
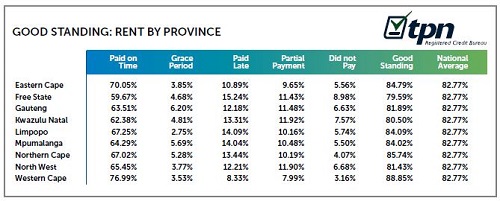
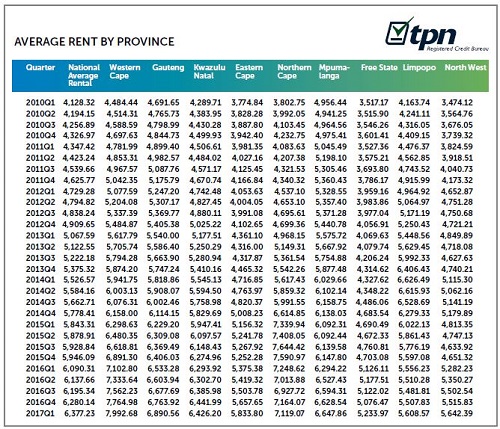
Courtesy: TPN - Tenant Profile Network

Published by TPN Credit Bureau
ACS House, 370 Rivonia Boulevard, Rivonia 2128, South Africa
Website: www.tpn.co.za

© 2005 - 2026 | Portfolio Property Investments | Powered by the PPI Business Platform