


Housing review Second quarter 2015
ECONOMIC OVERVIEW
The global economy
The International Monetary Fund’s (IMF) latest assessment of global economic conditions, published in the April 2015 World Economic Outlook, showed that real world economic growth was 3,4% in 2014, unchanged from 2012 and 2013. Growth in advanced economies improved somewhat last year, whereas growth in emerging markets and developing countries slowed down over the same period. Sharply lower international oil prices up to early 2015, after peaking in mid-2014, were a boost to demand and caused downward pressure on inflation over a wide front. However, oilexporting and commodity-driven countries experienced lower levels of revenue as a result of the lower oil and other commodity prices. Oil prices stabilised towards end-January and rebounded to some extent since early February.
The following trends were observed in some of the major advanced and emerging and developing economies:
Inflation has been on a downward trend in advanced and developing economies, driven by lower oil and other commodity prices, as well as weakening levels of demand in a number of countries. Against this background monetary policy remained accommodative in advanced economies and was eased further in some countries, whereas currency weakness and low commodity prices resulted in policy conditions remaining tight in especially emerging and developing countries reliant on oil and other commodity exports for economic growth.
The South African economy
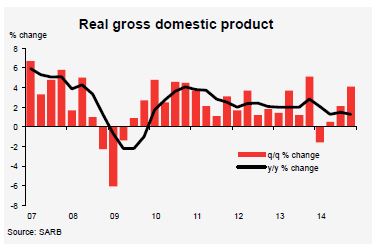
The fourth quarter of 2014 saw growth of 4,1% at a seasonally adjusted, annualised rate in South Africa’s real GDP, up from 2,1%, 1,5% and -1,6% in the third, second and first quarters of last year respectively, with full-year real GDP growth down to 1,5% last year from 2,2% in 2013. The country’s growth performance in 2014 was impacted by moderate global growth, electricity supply constraints and labour strikes in some sectors of the economy in the first seven months of the year, which severely affected production, investment decisions, confidence levels and employment.
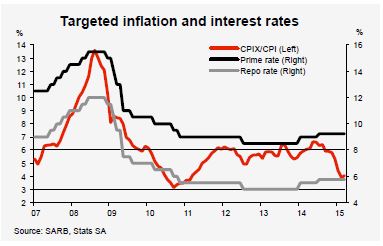
Headline consumer price inflation was on a downward trend late last year and in the early months of 2015, after reaching a level of 6,6% y/y in mid-2014. The lower inflation was largely driven by slowing food price inflation and sharply declining fuel prices, which were the result of the relatively low international oil prices up to early this year. However, fuel prices were hiked again in March and April on the back of $/R exchange rate movements and a rebound in oil prices from February, as well as an increase in fuel taxes announced in the national Budget in February. The higher fuel prices contributed to the headline inflation rate increasing to 4% y/y in March from 3,9% y/y in February, which brought the first quarter average to 4,1% y/y. Underlying core inflation, i.e. headline inflation excluding the more volatile components of food, non-alcoholic beverages, petrol and energy, remained relatively stable at a level of 5,7% y/y since mid-2014.
Interest rates were kept unchanged up to the end of April this year after being hiked by a cumulative 75 basis points in 2014. The repurchase rate, or repo rate, which is the key monetary policy interest rate and the rate at which commercial banks borrow money from the Reserve Bank, is currently at 5,75% per annum, with commercial banks’ prime lending and variable mortgage interest base rates for extending credit to the public at a level of 9,25% per annum.
Household sector overview
South African consumers received some financial relief from declining fuel prices since late 2014 up to early 2015, but fuel prices have risen again in March and April, whichwill have an inflationary impact in the near-term. Despite the recent short-lived fuel price bonanza, the household sector in many respects continued to experience financial strain in 2014:
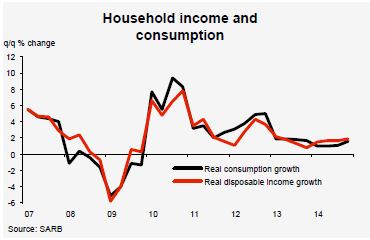
Growth in real household disposable income, i.e. after-tax, inflation-adjusted income, increased to an annualised rate of 1,9% in the fourth quarter of 2014 from 1,7% in the third quarter. Full-year real disposable income growth was 1,5% in 2014, down from 2,5% in 2013. The uptick in the fourth quarter income growth was driven by the normalisation of salary and wage income of workers affected by strikes, which lasted into the third quarter, and declining inflationary pressures in the last three months of the year. According to Andrew Levy Employment Publications, the nominal wage settlement rate came to 8,1% in 2014 (7,9% in 2013), which was above the average headline consumer price inflation rate of 6,1% y/y in 2014.
Real household consumption expenditure growth improved from an annualised rate of 1,1% in the third quarter of 2014 to 1,6% in the fourth quarter, with the full-year growth at 1,4%. The higher real consumption growth towards the end of last year resulted from faster growth in real disposable income and declining consumer price inflation over the same period, as well as a gradual improvement in the net household savings ratio during the course of the year (see below). However, the close correlation between growth in real household disposable income and growth in consumption expenditure continued up to end-2014 and remains related to the general lack of household savings, as well as many consumers’ limited financial ability to access credit for the purpose of consumption. These aspects remain an indication of households’ huge reliance on income and credit to fund consumption expenditure in the absence of sufficient savings to support spending.
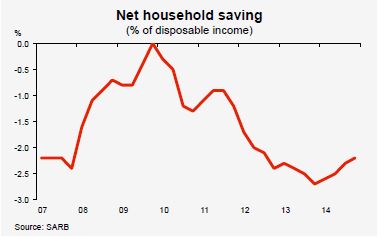
The ratio of net household savings to disposable income, in negative territory since 2006, improved gradually from a level of -2,6% in the first quarter of 2014 to -2,2% in the fourth quarter, driven by some improvement in disposable income growth during the course of the year. Net household savings are calculated from gross savings, adjusted for depreciation write-offs on the value of physical assets held by households, such as residential buildings and vehicles.
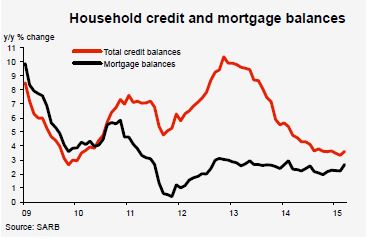
Growth in the value of outstanding household credit balances, comprising instalment sales credit, leasing finance, mortgage loans, credit card debt, overdrafts and general loans and advances (mainly personal and micro loans), remained low at between 3% y/y and 3,5% y/y in the early months of 2015. Growth in the value of outstanding household secured credit balances (instalment sales credit, leasing finance and mortgage loans) was below 3% y/y since the start of the year, largely driven by subdued growth of just above 2% y/y in household mortgage balances, which account for more than 77% of total household secured credit balances. Growth in the value of outstanding household unsecured credit balances (credit card debt, overdrafts and general loans and advances) was around 5% y/y since end-2014. Growth in unsecured credit balances is largely driven by the component of general loans and advances (60,7% of household unsecured credit balances and mainly consisting of personal loans and microfinance), which dropped to below 4% y/y recently. Factors such as the National Credit Act (NCA), banks’ risk appetite and lending criteria, consumers’ credit-risk profiles and consumer confidence affected the availability and accessibility of and demand for household credit.
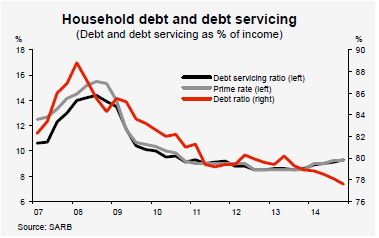
The ratio of household debt to disposable income was lower at 77,6% in the fourth quarter of 2014 from 78,1% in the third quarter, with the annual average at 78,2% - its lowest level since 2006. Declining growth in household credit balances contributed to the steady downward trend in the ratio of debt to income. The debt ratio is calculated as the total amount of outstanding household debt expressed as a percentage of the total annual disposable income of households, i.e. after deductions for tax, social contributions and transfers.
The household debt service-cost ratio increased gradually from 8,6% at the end of 2013 to 9,3% in the final quarter of 2014, mainly as a result of the interest rate hikes in January and July last year. This ratio is the interest component of debt repayments expressed as a percentage of disposable income and took account of the debt-to-income ratio of 77,6% in the fourth quarter of last year and the average lending rate paid on debt during this period. Based on the abovementioned debt-to-income and debt servicecost ratios, the average interest rate charged in the fourth quarter of 2014 to service household debt was around 11,98% per annum, which was 2,73 percentage points above the ruling average prime interest rate of 9,25% per annum over this period. The premium paid by consumers on total outstanding debt, i.e. secured and unsecured debt, of above the prime lending rate is the result of the state of consumer finances, credit-risk profiles, and banks’ risk appetite and lending criteria against the background of expectations that interest rates will be hiked further in the next 12 to 18 months.
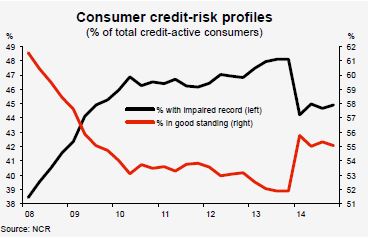
Statistics on consumer credit-risk profiles since the first quarter of 2014, published by the National Credit Regulator (NCR), reflect changes to credit regulations announced in late 2013 to make provision for a credit amnesty process, which came into effect on 1 April 2014. The shift in the data in the first quarter of last year occurred as a result of credit bureaus implementing the changed regulations as from that quarter. The credit amnesty process involves the continuous removal of adverse credit information kept by credit bureaus with regard to consumers who have repaid their debt. The amnesty, however, does not relieve consumers from the obligation to repay outstanding debt.
The latest trends in consumer credit-risk profiles were as follows:
Consumers’ credit-risk profiles impact their access to credit, as reflected by banks’ risk appetite and lending criteria, which eventually affect household consumption expenditure against the background of a continued low level of savings.
Consumer financial vulnerability, as measured by the Bureau of Market Research (BMR), deteriorated marginally in the fourth quarter of 2014 from the third quarter. At an overall Consumer Financial Vulnerability Index (CFVI) reading of 51,2 in the fourth quarter (51,4% in the third quarter), consumers remained financially mildly exposed. The annual average index reading was 50,8 last year compared with 48,9 in 2013. An index reading of 50-59,9 in the CFVI and its sub-indices indicates that consumers are financially mildly exposed. An index reading of 40-49,9 indicates that consumers are financially very exposed, whereas an index reading of 60-79,9 indicates that consumers are financially very secure. The sub-components of the CFVI were measured as follows in the fourth quarter of 2014:
The top five reasons for financial vulnerability were cited as too much debt (76,5% of respondents in the CFVI survey); spending more than earning (70,6%); bad financial planning (60,8%); loss of employment (52%); and lack of sufficient savings for emergencies (44,1%).
Statistics South Africa’s latest Quarterly Labour Force Survey showed a total of 15,32 million people were employed in the formal and informal sectors of the economy at the end of 2014. With the labour market severely affected by major strikes in some sectors of the economy during last year, only 0,9% more people were employed by year-end compared with end-2013. The unemployment rate was 24,3% at the end of 2014, with a total of 4,909 million people being unemployed at the time. Based on statistics published by Andrew Levy Employment Publications, a total number of 11,8 million workdays were lost due to industrial action in 2014, compared with 5,2 million lost in 2013 and 3,5 million lost in 2012. These labour market trends are not conducive to higher levels of confidence, investment and employment in the medium to longer term.
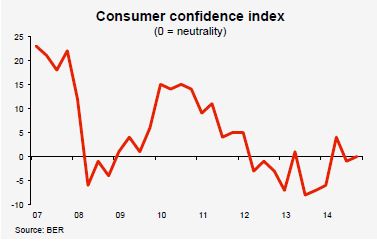
According to the Bureau for Economic Research (BER), consumer confidence remained low in 2014, measured at a level of 0 index points in the fourth quarter of the year and averaging -0,8 index points for the full year. These index readings were well below the average of +5 in the past twenty years, which were also the case in 2012 and 2013. Consumer confidence is measured by expectations regarding the outlook for the domestic economy, household finances and durable consumption expenditure. Consumer confidence remains an important factor with regard to the demand for credit, which is crucial for household consumption expenditure, especially the durable component thereof.
The main tax proposals for 2015/16 announced in the national Budget in February, which will have an impact on individuals and households, were as follows:
Property sector overview
In the fourth quarter of 2014 there were 6,07 million residential properties in South Africa with a total value of R4,27 trillion, of which 2,11 million properties with a total value of R2,25 trillion were bonded, whereas 3,96 million properties with a total value of R2,02 trillion were nonbonded. These statistics with regard to the residential property stock in the country are supplied by Lightstone (see relevant table at the back of the report).
Residential building activity remained largely subdued and contracted further in the early stages of 2015 compared with a year ago. The number of new housing units for which building plans were approved was down by 6,1% y/y to 8 444 units in January and February. This was the result of a contraction in plans approved in respect of both categories of houses, whereas plans approved in the segment of flats and townhouses increased by more than 23% y/y in January and February. The volume of new housing units reported as constructed dropped by 1,6% y/y in the first two months of the year, driven by a contraction in the number of units built in both the segments of houses, whereas the number of flats and townhouses built was up by more than 3% y/y in January and February. The demand for and supply of new housing remain focused on the segments of smaller-sized houses and higher-density flats and townhouses, with these categories that had a share of more than 70% of new housing built in the past 20 years. These trends are driven by factors such as urbanisation, land scarcity, building costs, housing affordability, propertyoperating costs (property rates and taxes, levies, electricity, etc.) and changing lifestyles in especially the metropolitan areas of the country.
Building confidence, based on the BER’s building confidence index, was somewhat lower in the first quarter of 2015 from the preceding quarter, but remained above the neutral level of 50 with a reading of 55. The decline in building confidence mainly resulted from deteriorating conditions in residential building activity recently (see above). The building confidence index measures prevailing business conditions in the building industry sub-sectors of architects, quantity surveyors, main building contractors, sub-contractors, manufacturers of building materials and retailers of building materials and hardware.
The variable mortgage interest rate was at 9,25% per annum at the end of April 2015, after interest rates were hiked by a cumulative 75 basis points last year. The impact of changes in the mortgage interest rate is reflected in the relevant tables at the back of the report, presenting monthly mortgage repayments for various loan amounts at various interest rates, as well as mortgage loan amounts based on various fixed monthly repayments at various interest rates. These calculations are based on a 20-year repayment term.
The residential mortgage market continued to show subdued growth up to the end of March this year, impacted by trends in the economy, household finances, consumer credit-risk profiles, banks’ risk appetite and lending criteria and consumer confidence. Growth in the value of outstanding household mortgage balances remained low at just below the 3% level at the end of the first quarter of the year. Outstanding mortgage balances are the net result of property transactions, mortgage finance paid out, capital and normal monthly repayments on mortgage loans as well as loans fully paid up.
The residential rental market showed some deterioration towards the end of 2014, according to Tenant Profile Network (TPN) Credit Bureau’s Rental Payment Monitor for the fourth quarter of last year. Rent paid on time dropped by two percentage points to 71% from the third quarter, with 10% of tenants paying late, 9% paying within the grace period of the first seven days of the month, 9% making a partial payment only and 5% of tenants not paying rent at all. With the average national residential rental tariff at R5 620 a month in the fourth quarter of last year, these trends are a further indication of the state of consumer finances and the financial strain experienced by households. Housing rental indices, as published by Statistics South Africa, showed that rental inflation measured 4,7% y/y for houses, 5% y/y for townhouses and 6,1% y/y for flats in the first quarter of 2015.
As announced in the national Budget in February, the rate structure for transfer duty on property was adjusted on 1 March 2015 to provide relief from this tax to low and middle-income households. The new rate structure eliminates transfer duty on all property acquired up to the value of R750 000 in 2015/16. The maximum value of a property exempted from transfer duty was R100 000 in 2002/03; R140 000 in 2003/04; R150 000 in 2004/05; R190 000 in 2005/06; R500 000 in 2006/07 to 2010/11; and R600 000 in 2011/12 to 2014/15.
Based on the newly-adjusted transfer duty rate structure, the effective liability for this tax decreases up to a property value of about R2,65 million, with a subsequent increase in the transfer duty liability above this amount (see tables at the back of the report). The revenue from transfer duty on property is budgeted at R7,3 billion in 2015/16, with a contribution of 0,7% to total tax revenue.
According to Absa’s house price data, nominal and real year-on-year house price growth was largely lower in most segments of the market in the first quarter of 2015 compared with the same period a year ago, driven by economic conditions impacting the household sector (see section below and tables at the back of the report on house price trends).
House prices
After performing relatively well in 2014, nominal and real year-on-year growth in the average value of homes in the middle segment of the market slowed down in the first quarter of 2015, with price growth in the luxury segment also tapering off over the same period. The slowdown in nominal price growth in middle-segment housing was already evident in the fourth quarter of last year. However, year-on-year price growth in the affordable housing segment accelerated somewhat in the first quarter of the year from the final quarter of last year. The recent trends in house price growth came against the background of economic developments and trends in household finances and consumer confidence.
The nominal price of a property refers to the price at which it was valued or transacted on the open market, i.e. market price, selling or purchase price and is reflected in a valuation, an offer to purchase, an application for mortgage finance and the transfer documents at registration.
The real price of a property is the nominal price adjusted for the effect of inflation, and is calculated to determine if the value of a property has increased at a rate above or below the inflation rate. In addition to the nominal price, real property price trends and growth are important from a property investment point of view.
The residential property price trends presented in this report are based on the value of properties for which Absa received and approved applications for mortgage finance. As a result, price movements may reflect changed market strategies and lending criteria implemented by the bank, impacting differently on the various segments of housing analysed. Real price calculations are based on nominal prices deflated by the headline consumer price index. All price data series are seasonally adjusted and smoothed in an attempt to exclude the distorting effect of seasonal factors and outliers, which may have the effect of recent price data and growth rates differing from previously published figures.
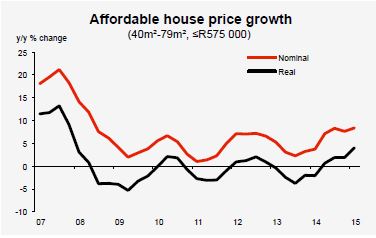
Affordable housing
The first quarter of 2015 saw the average price of affordable housing (homes of 40m² ─ 79m² and priced up to R575 000 in 2015) increasing by a nominal 8,3% y/y (7,7% y/y in the preceding quarter) to about R390 000. Real price inflation of 4% y/y was registered in the first quarter of the year (1,9% y/y in the fourth quarter of last year).
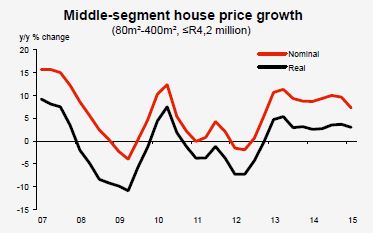
Middle-segment housing
The average nominal price of a home in the middle segment of the market (homes of 80m² ─ 400m² and priced at R4,2 million or less in 2015) increased by 7,3% y/y to a level of more than R1 322 000 in the first quarter of 2015 compared with growth of 9,6% y/y and 9,9% y/y in the fourth and third quarters of 2014 respectively. Real price inflation in middle-segment housing came to 3% y/y in the first quarter of the year.
The following price changes occurred in the three middlesegment categories in the first quarter of 2015:
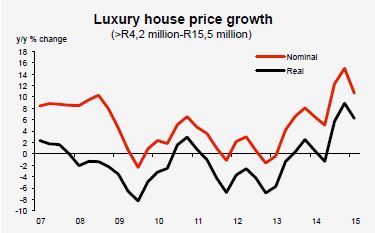
Luxury housing
The average price of luxury housing (homes priced at between R4,2 million and R15,5 million in 2015) increased by a nominal 10,6% y/y to a level of about R5 767 000 in the first quarter of 2015, down from 15% y/y in the fourth quarter of 2014. In real terms, the average price in this category of housing was up by 6,2% y/y in the first quarter after real growth of 8,9% y/y in the preceding quarter.
As the sample size of luxury-segment housing is relatively small, a number of transactions of a higher value could have contributed to the strong price growth in recent quarters.
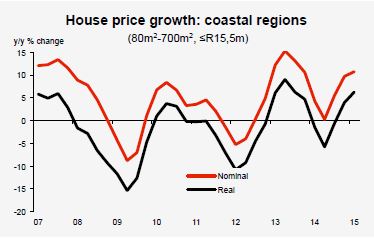
Regional house prices
The performance of the residential property market at geographical level is affected by national economic trends in general. However, regional property markets may react differently to macroeconomic developments as a result of additional area-specific factors, such as location, physical infrastructure, sectoral economic composition and the level and extent of economic growth and development. These factors may affect property demand and supply conditions, market activity, buying patterns, transaction volumes and price levels and growth at regional level.
At a provincial level house prices dropped in most regions on a nominal and real basis in the first quarter of the year, indicating that economic conditions, trends in household finances and the level of consumer confidence had an adverse effect on the property market in the early stages of 2015. However, house price growth at provincial and metropolitan level was headed up by Cape Town in the Western Cape, reflected by a relatively lively property market there.
The coastal areas of the Western Cape saw relatively strong year-on-year price growth in the first quarter of the year, with a contraction in prices along the KwaZulu-Natal coast.
The coastal property market, normally having a relatively large investment and leisure focus, experienced a lot of downward price pressure in recent years against the background of financial strain experienced by the household sector in general. However, an improvement in market conditions along the coast is evident in view of continued excellent buying opportunities in certain areas.
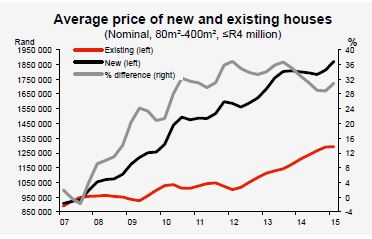
New and existing housing
The average price of a new home increased by 3,9% y/y in the first quarter of 2015, while marginal real price deflation of 0,2% y/y was recorded. The average price of a new home was R1 869 400 in the first quarter of the year.
The average price of an existing house increased by a nominal 7,2% y/y to R1 291 300 in the first quarter of the last year, which resulted in real year-on-year price growth of 2,9% in the quarter. As a result, it was around R578 100, or 30,9%, cheaper to have bought an existing house than to have had a new one built in the first quarter of 2015.
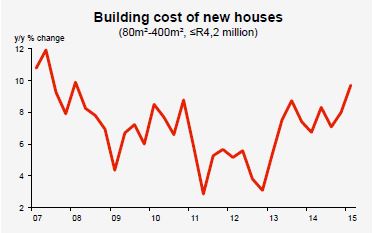
Building costs
Building costs continued to rise at a faster rate than the average consumer price inflation rate, impacting the prices of newly built housing as well as renovations and alterations to existing housing. The cost of having a new house built increased by 9,7% y/y in the first quarter of 2015, up from an increase of 8% y/y in the fourth quarter of last year.
Factors impacting building costs, and eventually the price of new housing, include building material costs; equipment costs; transport costs; labour costs; developer and contractor profit margins; and the cost of developing land for residential purposes, which is impacted by aspects such as finance costs, land values, the cost of rezoning, the cost of preparing land for construction and holding costs in general.
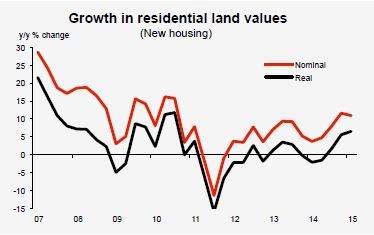
Land values
The value of vacant residential stands in the middle and luxury segments of the housing market for which Absa received applications and approved mortgage finance, increased relatively strongly by a nominal 10,9% y/y to an average of about R627 200 in the first quarter of 2015, after having risen by an equally strong 11,6% y/y in the fourth quarter of last year. In real terms residential land values were up by 6,5% y/y in the first quarter, after rising by 5,6% y/y in the preceding quarter.
The average price of land for new middle-segment and luxury housing came to 27,8% of the total value of a new residential property in these segments in the first quarter of 2015, with this ratio averaging 27,3% in the past three years.
Residential land values reflect the all-important factors of location, the availability of suitable land for development, the availability of municipal services such as electricity, water, sewerage and refuse removal, the availability, condition and accessibility of transport infrastructure and the proximity to places of work, schools, shopping centres, medical facilities, etc.
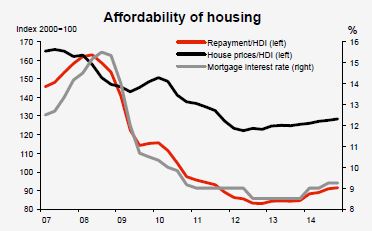
Affordability of housing
The affordability of housing continued to gradually deteriorate up to the fourth quarter of 2014, as reflected by the ratios of house prices and mortgage repayments to household disposable income. This was the net result of nominal house price growth of 9,6% y/y and nominal disposable income growth of 7% y/y in the quarter, while the mortgage interest rate was unchanged at 9,25% per annum in the fourth quarter of the year.
Apart from trends in house prices and the mortgage interest rate, households’ ability to afford housing is also influenced by other factors such as employment, income, savings, living costs, debt levels, credit-risk profiles (as reflected by the state of consumer credit records), National Credit Act stipulations and banks’ risk appetite and lending criteria in the case of applications for mortgage finance to acquire property.
A downward/upward trend in the abovementioned two housing affordability ratios implies that house prices and mortgage repayments are rising at a slower/faster pace than household disposable income. The result is that housing is in effect becoming more/less affordable.
OUTLOOK
The global economy
The IMF projects world economic growth of 3,5% in 2015 and 3,8% in 2016, with growth to remain largely uneven across the major economies and geographical regions. The prospect is for growth in advanced economies to improve gradually in 2015 from last year as a result of the supporting effect of lower oil prices, but the outlook for growth in emerging and developing countries is down from 2014 on the back of country-related aspects and the impact of lower commodity prices. Although oil prices have rebounded since late January, the outlook remains largely uncertain, with eventual risks for world inflation, monetary policy and economic growth.
Growth in advanced economies is forecast to rise to 2,4% in 2015 from 1,8% in 2014, with growth in 2016 to be in line with this year at 2,4%, with the following outlook in the major economies:
Economic growth in emerging and developing countries is forecast at 4,3% in 2015 (4,6% in 2014) and 4,7% in 2016, with growth to be affected by the lower commodity prices and a slowdown in some prominent economies in this group of countries:
The South African economy
The South African economy is forecast to grow by a real 2% in 2015 and 2,4% in 2016, driven by domestic conditions, demand and global growth over the next two years. However, continued severe electricity supply constraints remain a major risk to the performance of the economy, with expected rising inflation and higher interest rates into 2016 to impact the growth prospects.
After slowing down to below 4% y/y in February, headline consumer price inflation is forecast to rise to just above 7% y/y by year-end to an average of 5,4% in 2015. The upward trend in inflation will be the result of expected higher food price inflation, electricity price hikes and rising fuel prices due to $/R exchange rate and oil price movements. Consumer price inflation is forecast to subside from around 8% y/y in early 2016 to below 6% y/y by year-end, for an average of 6,6% for the full year.
The forecast is for domestic interest rates to be hiked later this year on the back of inflationary pressures in the rest of the year, while the South African Reserve Bank has commented in April that the near-term outlook for inflation has deteriorated and that interest rates will have to normalise over time on the back of economic data. Against this background domestic interest rates are forecast to be hiked by 25 basis points in September this year and by a further cumulative 75 basis points in 2016. This will bring commercial banks’ prime lending and variable mortgage interest rates on which credit extension to consumers and businesses is based to a level of 9,5% per annum at year-end and 10,25% per annum by the end of next year.
The household sector
Economic growth, employment, income growth, debt levels, inflation and interest rate trends will remain important factors impacting the state of and trends in household finances. Employment growth is forecast to remain relatively low, whereas growth in real household isposable income and consumption expenditure is set to rise from about 1,5% in 2014 to above 2% in 2015/16. The ratio of household consumption expenditure to GDP is forecast to remain around the 60% level over the forecast period, reflecting the importance of the consumer sector in economic activity. The household debt-to-income ratio is projected to subside gradually towards the end of 2016, but to remain above 75%, driven by some faster growth in income, while credit growth will be constrained by rising interest rates. Against the background of banks’ risk appetite and lending criteria, as well as expected rising interest rates, consumers’ credit-risk profiles will remain key to the accessibility of and growth in household credit, which will i pact consumption expenditure in view of a projected continued low level of household savings.
The property market
The residential property market will continue to be driven by economic trends, household finances and consumer confidence, which will affect the affordability of housing and the accessibility of and demand for mortgage finance. These factors will be reflected in trends in property demand and supply conditions, residential building activity, property prices, property market activity, buying patterns, transaction volumes, growth in mortgage advances and home loan repayment patterns.
House price growth is forecast to remain in single digits in 2015 and 2016, with price growth expected to be lower this year against the background of the outlook for the economy and household finance-related factors. Base effects will also contribute to lower price growth in 2015 compared with the previous two years when nominal price growth of between 9% and 10% was recorded. Based on the current forecasts for nominal house price growth and consumer price inflation, marginal real price inflation is projected for this year and next year.
Growth in outstanding household mortgage balances, which was at a level of just above 2% y/y in recent months, stands little chance of improving significantly against the background of expectations regarding interest rates, economic growth, the general state of household finances, credit-risk profiles and the level of consumer confidence.
The relatively subdued levels of residential building activity of the past five years show little sign of increasing substantially in the near-term, with activity levels contracting and building confidence declining in the first quarter of the year.
Courtesy: ABSA Bank

![]()
Compiled by: Jacques du Toit - Property Analyst
Absa Home Loans
45 Mooi Street, Johannesburg, 2001
PO Box 7735, Johannesburg, 2000, South Africa
Tel: +27 (0)11 350 7246
Email: [email protected]
www.absa.co.za
The information in this publication is derived from sources which are regarded as accurate and reliable, is of a general nature only, does not constitute advice and may not be applicable to all circumstances. Detailed advice should be obtained in individual cases. No responsibility for any error, omission or loss sustained by any person acting or refraining from acting as a result of this publication is accepted by Absa Bank Limited and/or the authors of the material.
Completion date: 30 April 2015

© 2005 - 2026 | Portfolio Property Investments | Powered by the PPI Business Platform