


The only comprehensive report on the state of the residential rental market in South Africa
2014 EDITION
PayProp Rental Index – 2014 annual report: Introduction
Now in its third year, the PayProp Rental Index has become the industry standard for data on the performance of the rental market in South Africa. Developed with the help of renowned economist, Mike Schüssler, it is the first, and still the only index that tracks actual transactions between tenants, landlords and estate agents to provide an accurate and comprehensive view of the market.
In our previous PayProp Rental Index we alluded to the future possibility of reporting on consumer data. We are pleased to announce that this is now a reality, with the first ever tenancy section to this report. The tenancy data yielded by the PayProp platform, combined with the raw Credit Providers Association database, provide South Africa’s most accurate and comprehensive view on the financial health of the average tenant.
Combining rental trends with data on the financial health of tenants provides a better understanding of the underlying “why” of the trends in rental data.
Stable but slow growth
Based on our ongoing assessment of rental trends,1 our view at the beginning of 2014 was that it was to be a year of stability.
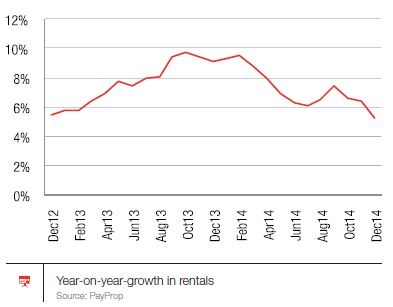
Our prediction largely held true until the third quarter, when a slow-down in the growth of average rental values followed, lasting the entire last quarter. The year started with an average national rental value of R5963 in January and ended on R6207 at the end of December.
Other measures indicate that it was anything but a flat market – average year-on-year growth for the 12 months was 7%.2 While this was not far below our predicted 8% for the year, the last quarter’s performance is definitely cause for concern. When looking at this trend over time, we see that the last quarter averaged only 6%, with a low of 5% at the end of December 2014, compared to a high of 10% in February 2014.
Limpopo drops back while the Northern Cape soars
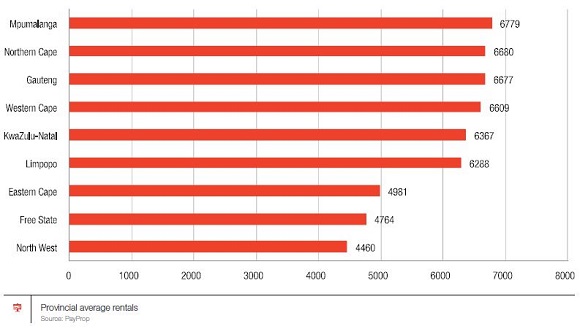
Provincially, the standout trend for the year was the slowing of rental growth in Limpopo – which only two years ago was still the most expensive province to rent in nationally. It seems that continued instability in the construction industry there is taking its toll, as a number of other provinces have knocked it off the top of the list of pricey provinces. Mpumalanga, while ahead of the rest for the past few indices, is facing strong competition from the Northern Cape, which in turn has shown incredible growth over the past 18 months as mining operations in the area expanded demand in a supply-constrained area. In fact, as predicted in the previous quarter, the Northern Cape has now overtaken Gauteng in this category.
The Northern Cape boasts four successive quarters of double-digit growth, ending the year with a quarterly average rental increase of 14.4%. Limpopo, on the other end of the scale, has seen growth rates drop from 9.9% in the first quarter to only 1.6% in the fourth. While most other provinces continued to perform on par with previous years, the Western Cape has been the only other province to show strong and stable growth. Starting the year at 8.9% and ending on 12.4% after two consecutive quarters of double-digit growth, the Western Cape has steadily climbed the provincial rankings, and we expect it to unseat Gauteng in the no. 3 spot by the second quarter of 2015.
Luxury rentals lead the pack
The graph below tracks percentage growth in the respective rental price bands, not the actual volume of rentals in each. The purpose is to understand which price bands are growing the fastest. Despite a slowing in growth over the four quarters, it is clear that the price category for rent above R15 000 is the fastest-growing in the country. When trying to understand which area is driving growth in the high-value rental category, it should come as no surprise that the Northern Cape is a major contributor. Here, high-value rentals have almost tripled in number over the year. It is interesting to see that practically all the growth in rental contract price bands in this area is happening in the over R7500 categories. Other geographic areas drawing interest with growth in the higher price categories are KZN and Gauteng.
Damage deposit ratios defy gravity
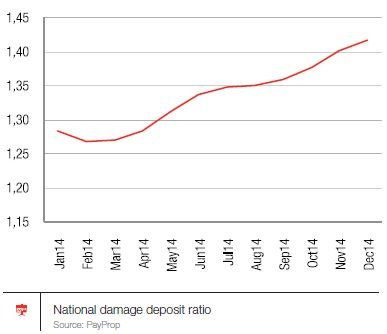
We noted continued steady growth throughout the year in the ratio of damage deposits to rentals. This figure started the year at 1.27, and steadily rose to 1.42 at the end of December 2014.
The Western Cape continues to drive damage deposit ratio growth – with Limpopo also putting in a notable increase over the last two quarters of 2014 (two times the monthly rental value seems to be becoming the norm).
Surprisingly, the Northern Cape is the one province where deposits of just under a month’s rental are still accepted – but with strong growth (from 0.70 times the average rental at the beginning of the year to 0.91 times at the end), it won’t be long before this area also reaches deposit levels greater than the monthly rental value.
As noted in previous indices, increasing deposit-to-rental ratios is driving the growth in deposit replacement products such as the PayProp DepositGuarantee, which provides landlords with 2.5 times the rental value in cover, in exchange for an affordable premium payable by the tenant.
Stable returns for investors
Investor returns have been exceptionally stable over the 12 months, with practically no change in national gross or net returns between the third and fourth quarters.
As foreseen at the outset of the year, any gains that landlords have seen in the increase of average rental values continued to be absorbed by the steady increase in the cost of ownership associated with investment properties.
Gauteng is now the most expensive province in which to own a property, with Limpopo the cheapest. Very interestingly for investors, the second cheapest province is now the Northern Cape. When combining the lower than- average cost of ownership and fastgrowing rental values, the Northern Cape is currently one of the darlings of buy-to-let investors – providing a net return of 6.27% compared to the national average of 5.05%.
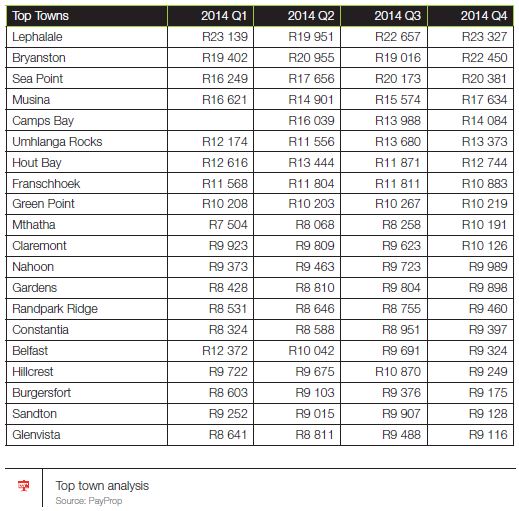
Top towns
Despite the slowing performance of the Limpopo province as a whole, Lephalale remains top of our list of South Africa’s most expensive towns in which to rent a property.
The landlord-tenant age gap
Nationally, there is a trend for owners of investment properties to be around a decade older than the tenants who rent from them. When looking back to October 2011, when we launched the PayProp Rental Index, it is clear that this is a fairly constant trend over time.
The Western Cape has the largest gap between tenants and landlords, and the North West the smallest.
Agent commissions as yet untouched
It is often the case that, as rental growth slows, owners look to reduce agent commissions in an effort to ensure that their property investments continue to generate good returns. At this point in time, we have not yet seen the effect of any landlord pressure on the commissions that letting agents are able to earn. This is probably the result of landlord returns not having been affected by the slower growth in rentals yet.
However, if the slow-down continues, the traditional 10% commission earned by letting agents may come under increasing pressure.
The provincial picture is extremely interesting, with the outliers being the Free State and Northern Cape. In both markets, estate agents earn in the region of 8% – well below the national norm of 10.27%. One can understand that the Free State, with its less robust rental market, would attract lower commissions, but this cannot be said for the Northern Cape. Our expectation is that, as the market continues to grow over the next year, Northern Cape commission levels will rise to levels around the national norm.
The average South African tenant
The information presented below was derived from aggregate data drawn from thousands of Tenant Assessment Reports compiled in the last quarter of 2014. All records in the sample represent individuals with valid South African ID documents and credit scores, but the data has been abstracted, allowing us to report on the trends without identifying the individual.
Eligibility for DepositGuarantee
PayProp Capital, a sister company of PayProp, recently launched DepositGuarantee – a product that replaces the traditional deposit requirement for the tenant while providing superior cover for the landlord. In order to be able to underwrite the risk, PayProp Capital performs an in-depth test of each tenant.
At the highest level, our data showed that 57% of tenants are eligible for the DepositGuarantee. It must be noted that, due to the underwriting requirements, the eligibility test is a much more stringent criterion than a general test for good tenancy – which means that at first glance, more than half of tenant applicants are considered “good tenants”, but may not be. DepositGuarantee weeds out more potentially bad tenants
Age and eligibility
When we drill down into the results of the DepositGuarantee eligibility test, the different dynamics of tenant risk become evident. Among other things, the data shows individuals older than 50 years have a much higher eligibility rating – more than 25% above those younger than 50 – pointing to the fact that older tenants tend to be more financially secure.
Age and income of the average tenant applicant
Looking at the broader characteristics of applicant tenants, we are able to better understand earning power across age categories. It is important to remember that the incomes tracked are derived from self-declared gross monthly earnings (which agents need to independently confirm). When analysing the data we noticed an interesting but unsurprising shape in the rise and fall of income across age brackets. We were also able to come to a benchmark of average incomes per age bracket, for the sake of affordability analyses. (The national average income of the sample, for example, is R30 896.)
Affordability
Affordability is a key component of managing tenant risk. The tenant may have a stable income and appear to be able to afford the rental at a glance, but the unknown factor is what effect the level of debt has on the tenant’s future ability to pay their rent.
To get a sense of the ability of tenants to meet their financial commitments, we took the national average income of the sample, deducted the applicable tax rate, and ran a calculation to determine disposable income. The calculation takes the average rental (data collected from tenant applications indicates this is just over R6200, which is in line with PayProp’s aggregate data) and deducts the average debt payments derived from the Q4 Tenant Assessment Report data set. The problem with this approach is that debt payments only include those items that are connected to a credit agreement registered with the credit bureaux. Household expenses such as medical costs, cleaning, utilities, fuel and food to mention just a few, are usually not included in this sort of quick and dirty affordability test, and must still come out of the remaining ‘disposable income’ – which is less than 25% of the total income!
The graph above also indicates that individuals on average face a debt burden that is nearly double their rental commitment, highlighting the importance of knowing tenants’ true exposure to debt.
Risk analysis
Building your business depends heavily on identifying and managing risk. One of the criteria that PayProp Capital applies to its eligibility rules makes reference to delinquencies. A major delinquency is defined as a significant and/or substantial default in an individual’s credit behaviour. This includes, among others, any account in arrears for more than a 90- day period, any judgment related to a debt commitment, and any tenant that is currently under debt restructuring.
The graph below shows the percentage of all applicants per age bracket who have recorded delinquencies. For instance, 28% of all applicants aged 20-29 whom we ran a report for have a major delinquency against their name. That percentage increases dramatically for individuals in the their 30s and 40s, scaling back in people in their 60’s and beyond.
Most credit checks provide a substantial amount of information relating to the various accounts an individual might have. To determine a tenant’s likelihood of fulfilling their financial commitments, PayProp does much more: The PayProp Tenant Assessment Report provides month-bymonth data on applicants’ ability to pay regularly and their ability to meet their financial obligations by assessing their debt exposure. This combination of measures offers a far better indicator of an individual’s financial discipline. Another equally important factor to consider is the type of debt the individual has committed to.
The graph below distinguishes between Credit Providers Association (CPA) accounts and those tracked under the National Loan Register (NLR). The CPA includes mostly mainstream finance products offered by banks (e.g. asset finance, credit cards), retailers (e.g. store accounts), contractual service providers (e.g. telecoms and satellite tv) and shortterm insurers. The NLR database is separate from the CPA and includes debt commitments individuals have under personal loan agreements they have entered into. This usually means personal loans offered through mainstream banks, but also includes loans to microlenders and payday loans, which usually charge significantly higher interest rates than CPA accounts. In case of an affordability assessment, we recommend paying very close attention to an individual’s NLR record. It is an early indicator of financial distress and default risk.
The results presented in the ‘Accounts and arrears by age category’ graph below reveal some important points to consider. As individuals move on from their twenties, they tend to double the number of credit contracts they enter into in their thirties, and this number stays constant until they reach retirement age. The average number of CPA accounts across all age groups is eight.
This in itself is not cause for alarm; the attention should be on an individual’s discipline in fulfilling their financial obligations. We believe any account that has been unpaid for 90 days or more is the greatest indicator of risk. With the national average of months in arrears at 3.4, this is a clear indicator that applicants are on average risky and should be carefully vetted. Looking at the data, individuals between 30 and 49 years are much higher risk than those younger or older, which might be considered counterintuitive.
For your interest…
Anyone who is familiar with our PayProp Rental Index or our national Masterclass events will know that we thrive on the analysis of data. We’re continually scouring the information available to us for answers to the questions our clients ask us, and we’re frequently surprised at the level of detailed insight we unearth.
This time around, we leave you with the following rather controversial data point – the income differential between men and women. Based on a calculation of age, split by gender, women earn on average 27% less than men – it seems we have some way to go in South Africa with regard to gender pay parity.
PLEASE NOTE: For the full market report and historical reports please refer to our RESOURCE CENTRE
Courtesy: PayProp

PayProp Rental Index
The PayProp Rental Index is a quarterly guide on trends in the South African residential rental market, and is compiled from actual transactional data collected by PayProp, the largest processor of residential letting transactions in South Africa. This edition details market conditions for the four quarters of 2014 combined.
Contact details
This publication has been produced by PayProp South Africa. PayProp South Africa is operated under licence from GivenGain International Limited. PayProp and the PayProp logo are registered trademarks of GivenGain International Limited.
For enquiries, please contact:
Louw Liebenberg
CEO: Property Payment Solutions (Pty) Ltd
Email: [email protected]
Tel: 087 820 7368
The PayProp Rental Index is available from the PayProp web site at www.payprop.co.za.
Sign up for PayProp
If you would like to know more about using PayProp to manage your rental portfolio, please visit www.payprop.co.za.
Disclaimer
This document is intended as a means for debate and discussion and should not be relied on as legal or professional advice. Whilst every reasonable effort has been made to ensure the accuracy of the contents, no warranty is made with regard to that content. PayProp will have no responsibility for any errors or omissions. PayProp recommends you seek professional, legal or technical advice where necessary. PayProp cannot accept any liability for any loss or damage suffered by any person as a result of the editorial content, or by any person acting or refraining to act as a result of the material included.

© 2005 - 2026 | Portfolio Property Investments | Powered by the PPI Business Platform